For an overview of all Ordoro Analytics’ sections, see this article.
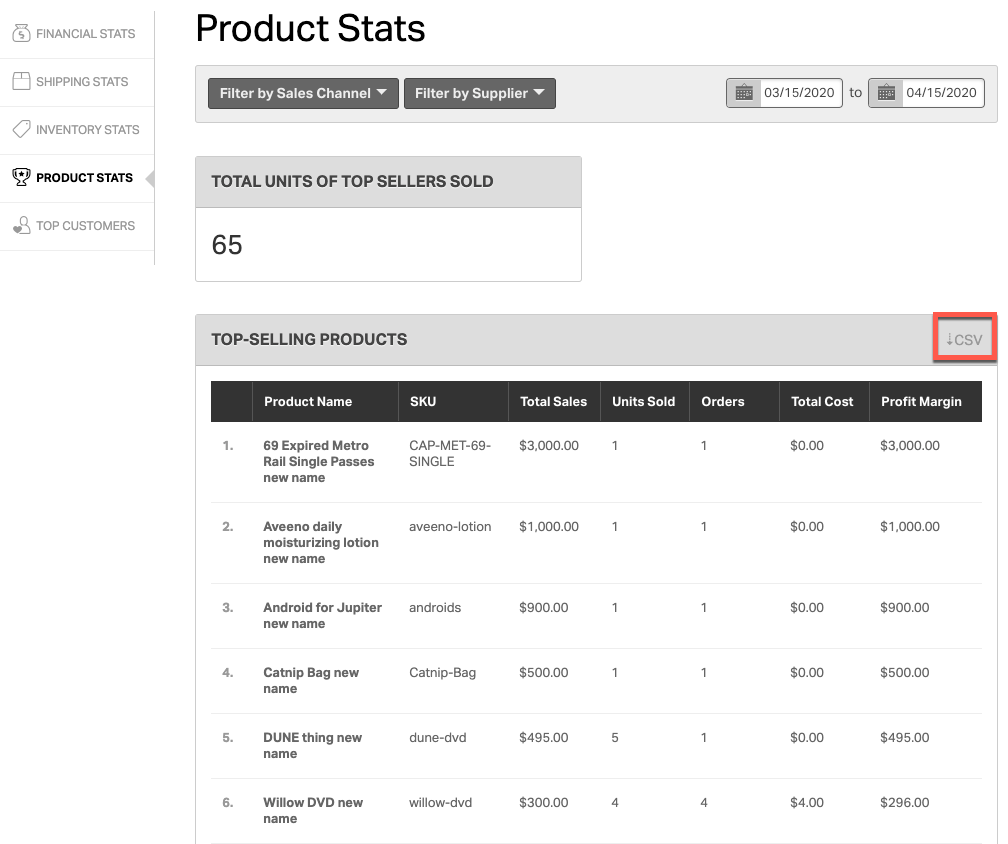
The Product Stats displays the top 20 best selling products in your business. This list can be filtered by date range, sales channel, and supplier (or brand). The data can also be exported to a CSV file by selecting the CSV icon in the upper right corner.
How does Ordoro calculate the Product Stats?
Ordoro reviews all orders received within the selected date range. Then, we sum the products’ sales prices, and aggregate per product. Lastly, we sort that list to identify the top 20 best selling products by sales revenue.
Here is a breakdown of each column header and where the information is pulled in Ordoro:
- Product Name = Ordoro’s product name.
- SKU = SKU saved in Ordoro.
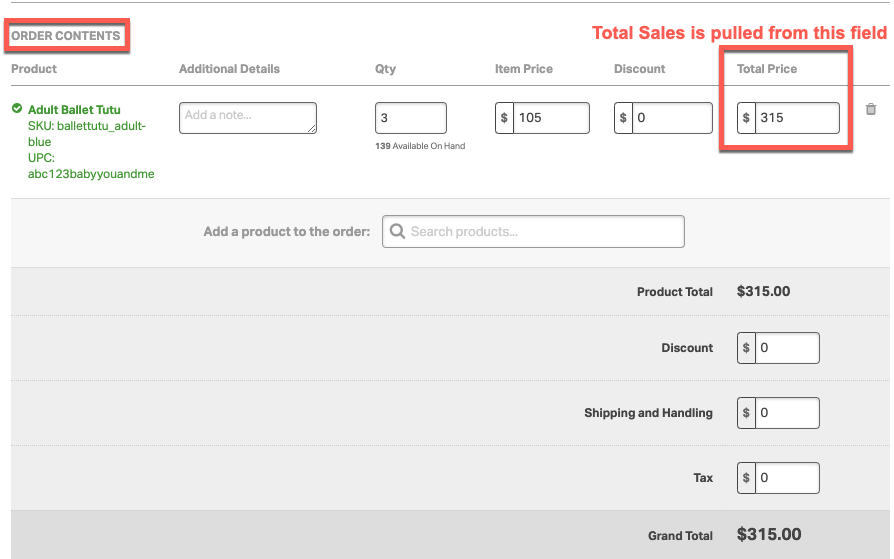
- Total Sales = Sum of all orders’ Total Prices. *see References below.
- Units Sold = Sum of units sold. Canceled orders are not included.
- Orders = Total count of of orders including the product.
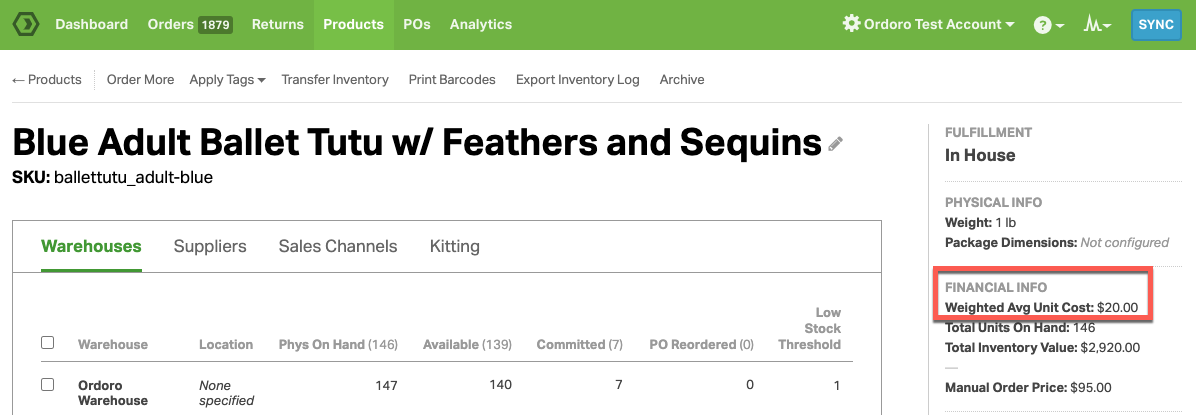
- Total Cost = Total Units Sold * Weighted Average Unit Cost *see References below.
- The Weighted Average Unit Cost value is whatever the value was when the order was placed.
- If multiple Weighted Average Unit Costs occur, we will sum the totals together for the Total Cost.
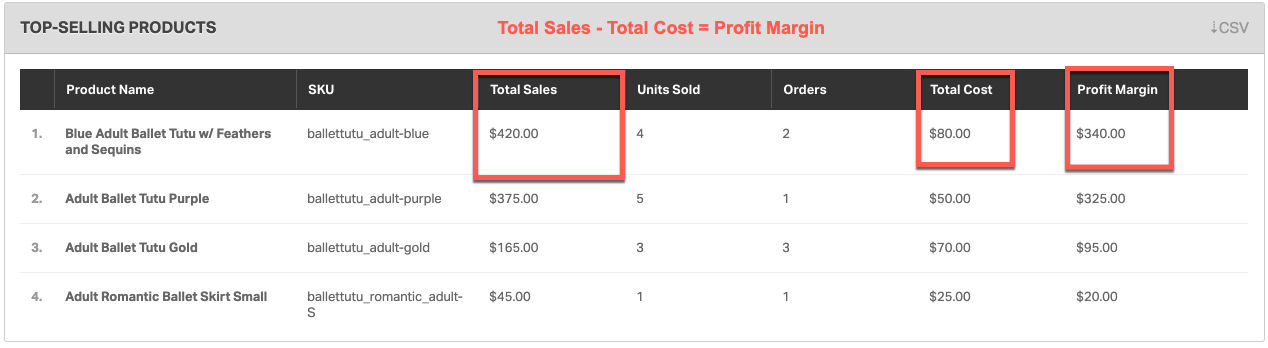
- Profit Margin = The difference between Total Sales – Total Cost.
References
1. Total Sales = The Total Price field is located in the Order Details page.
2. Total Cost = The Weighted Average Unit Cost is on the Product Detail page.
See this support article to see how to automatically calculate the Weighted Average Unit Cost per product when receiving Purchase Orders.
Regarding this note: “If multiple Weighted Average Unit Costs occur, we will sum the totals together for the Total Cost,” see the example below.
Example:
- Order ABC is placed for the following:
- SKU A
- Qty 1
- Weighted Average Unit Cost = $25
- Therefore, the Total Cost displayed in Analytics is $25.
- The Weighted Average Unit Cost is then updated to $20 in Ordoro for SKU A.
- Order 123 is placed for the following:
- SKU A
- Qty 1
- Weighted Average Unit Cost = $20
- Total Cost for this order = $20
- Total Cost displayed in Analytics = $45 ($25 from Order ABC +$20 from Order 123)
3. Profit Margin = The difference between Total Sales – Total Cost
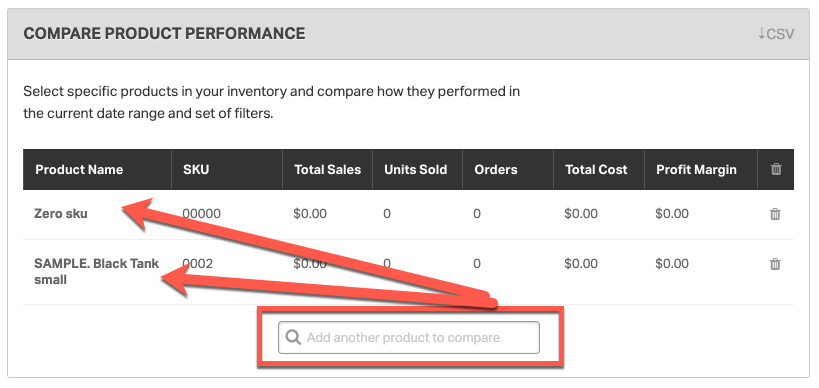
How to compare more than the top 20 products
The top 20 products are shown in the app, but there’s the ability to evaluate other products’ sales data using the Compare Product Performance feature. You can add products to this list by using the search bar included.
This report can also be exported by selecting the CSV icon in the upper right corner.
Please contact our support team at support@ordoro.com if you have any additional questions about Product Stats or our Analytics feature.