To see an overview view of all the different sections in Ordoro Analytics, see this article.
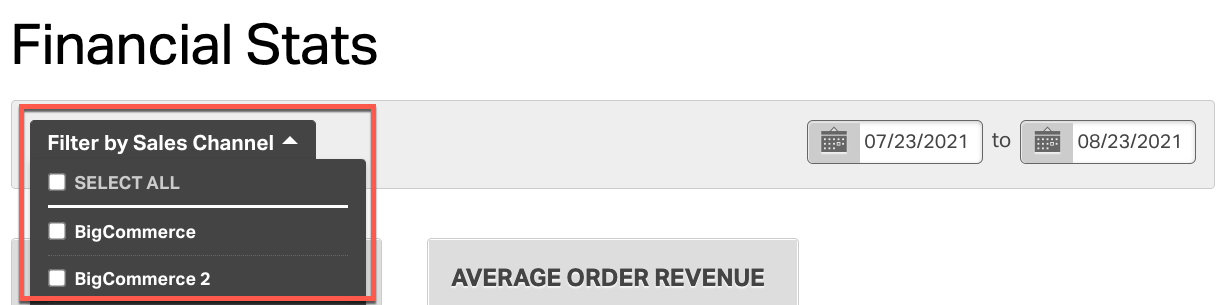
To see the financial stats for your company, click on the Analytics tab->Financial Stats. The Financial Stats section has six sub-sections
- Revenue by date range and sales channel
- Costs by date range and sales channel
- Revenue & Costs statement by date range and sales channel
- Revenue by state by date range and sales channel
- Revenue by sales channel
- Revenue by supplier
Each of these charts are explained below. You can filter the entire section by date range and sales channel by clicking on the filters at the top of the section.
Revenue
This section shows your total revenue over the date range (you can also filter by sales channel). The revenue is split up into multiple pieces.
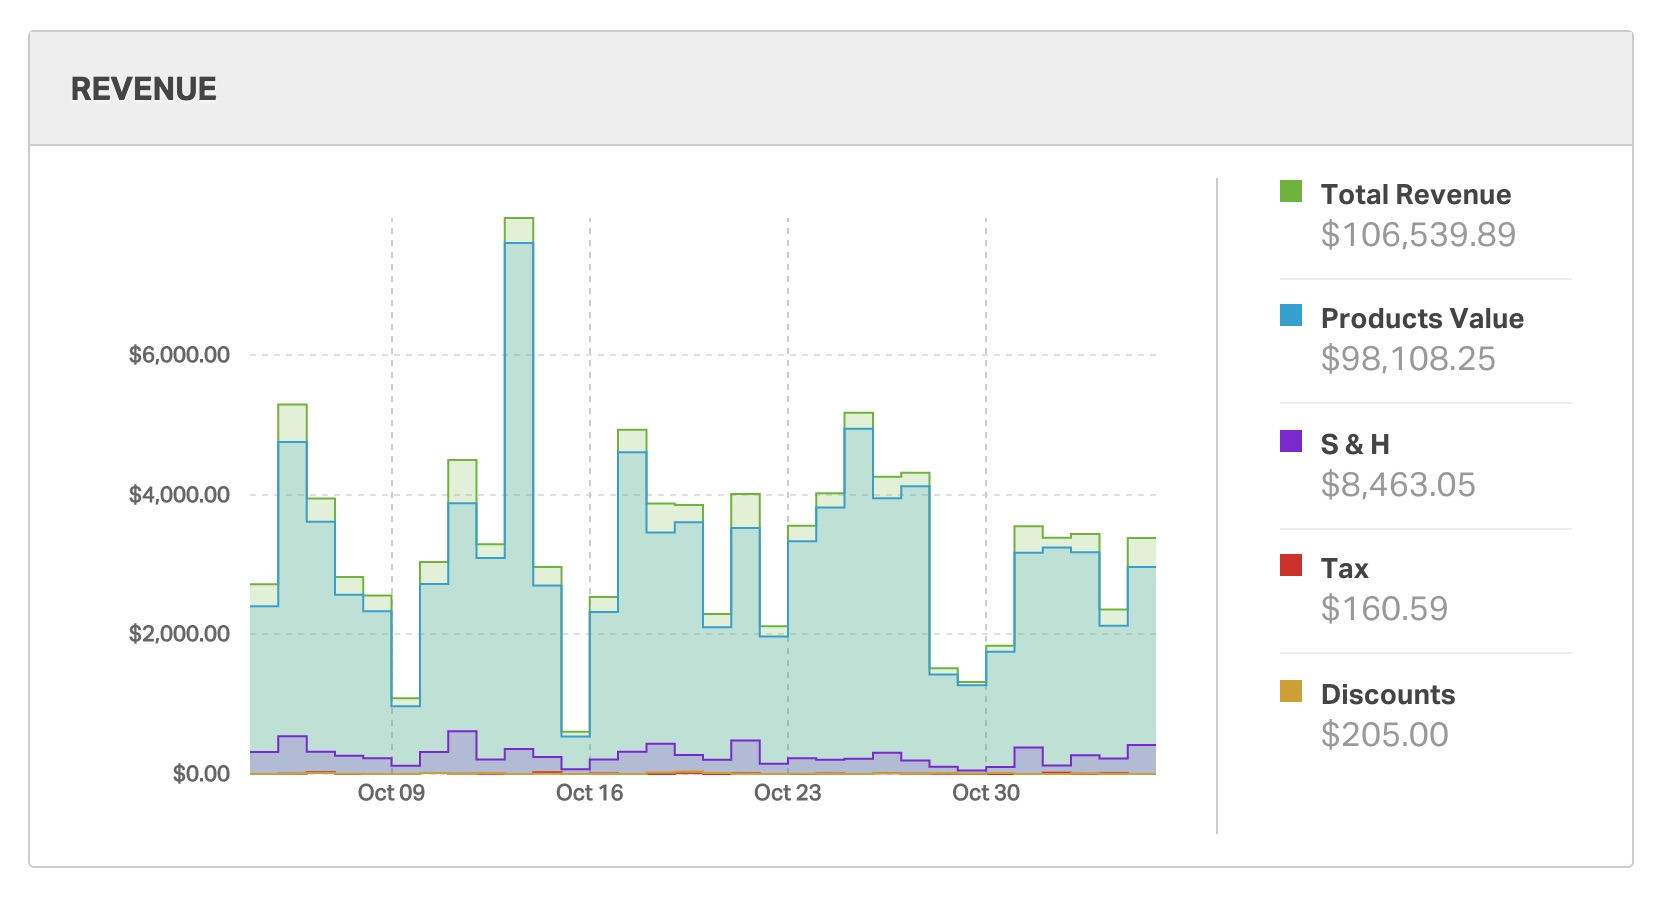
- Total Revenue – This is calculated by adding up the total price (grand total) of all orders received during the date range selected
- Note: Cancelled status orders are excluded from this total.
- Products Value – This is the sum of all product totals from all orders received during the date range selected
- S & H (Shipping and Handling) – This is the sum of all shipping & handling charged to your customers at the time of purchase in the Sales Channel from all orders received during the date range selected. (Note that this is different from the actual shipping and handling costs you incurred. This will be shown in the Costs section below)
- Tax – This is the total sales tax charged to your customers at the time of purchase in the Sales Channel from all orders received during the date range selected
- Discounts – This is the total discount amount offered to your customers at the time of purchase in the Sales Channel from all orders received during the date range selected
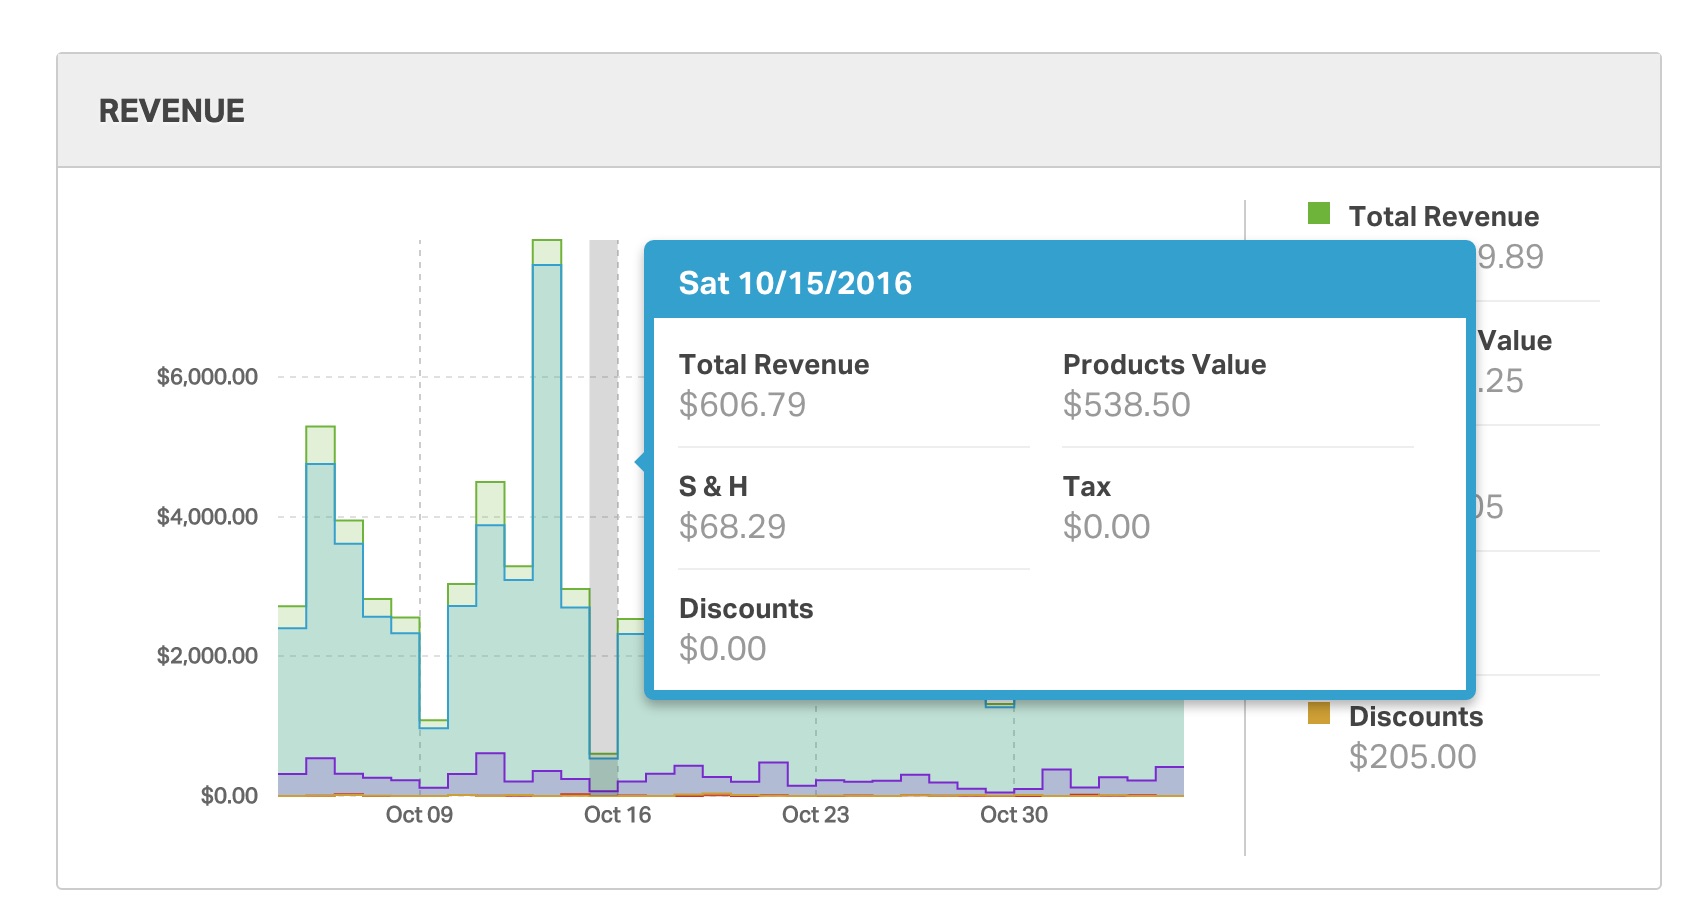
You can mouse-over the chart to see these numbers for any given date in the date range selected.
Costs
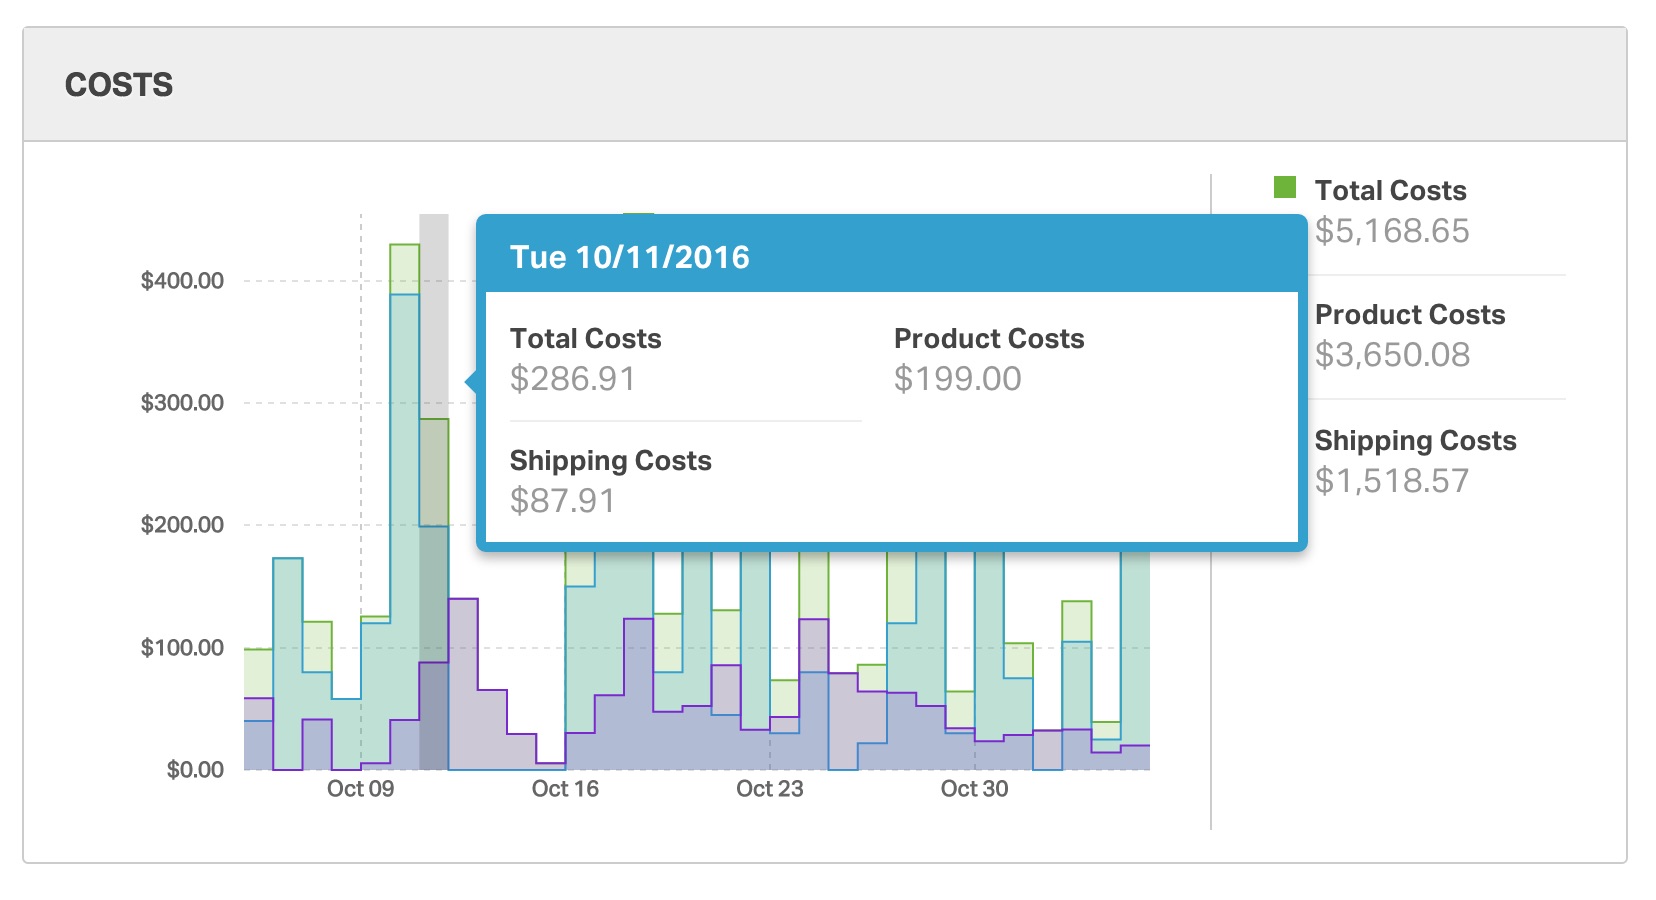
This section shows the total costs incurred (product costs, shipping & handling costs) within the date range selected.
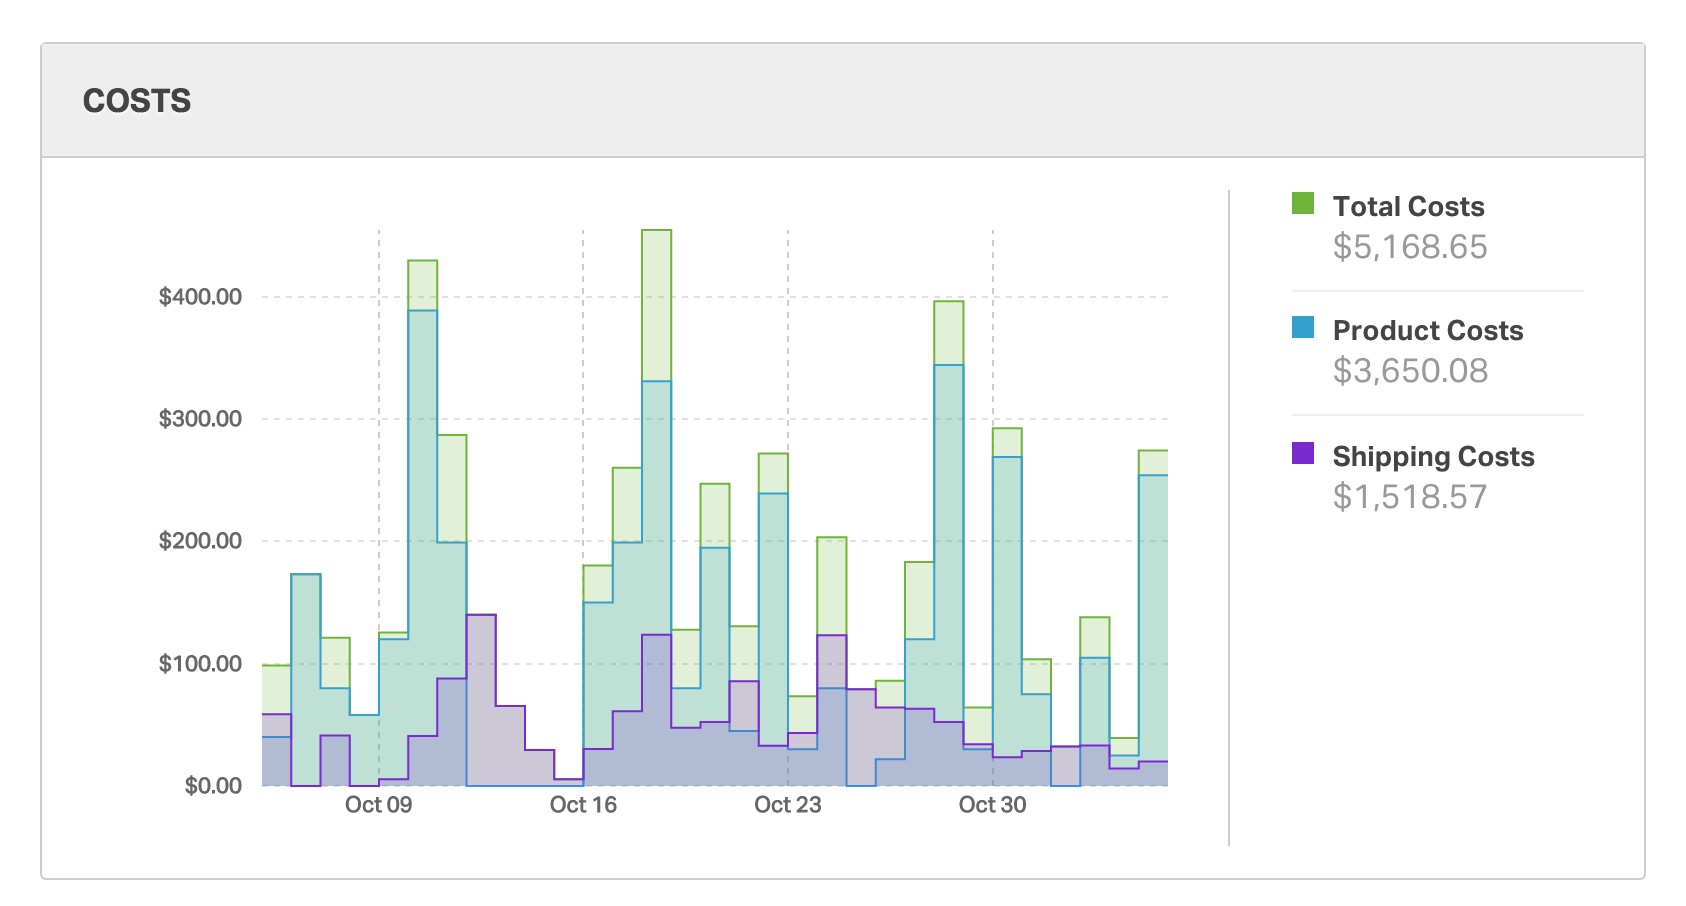
- Product Costs – This is calculated as the sum of inventory costs on all products on new, in process, archived, and shipped orders during the date range selected. Note the product cost is pulled from the Total Value of Inventory field in the Product Details page. The cost should reflect your purchase price from your supplier.
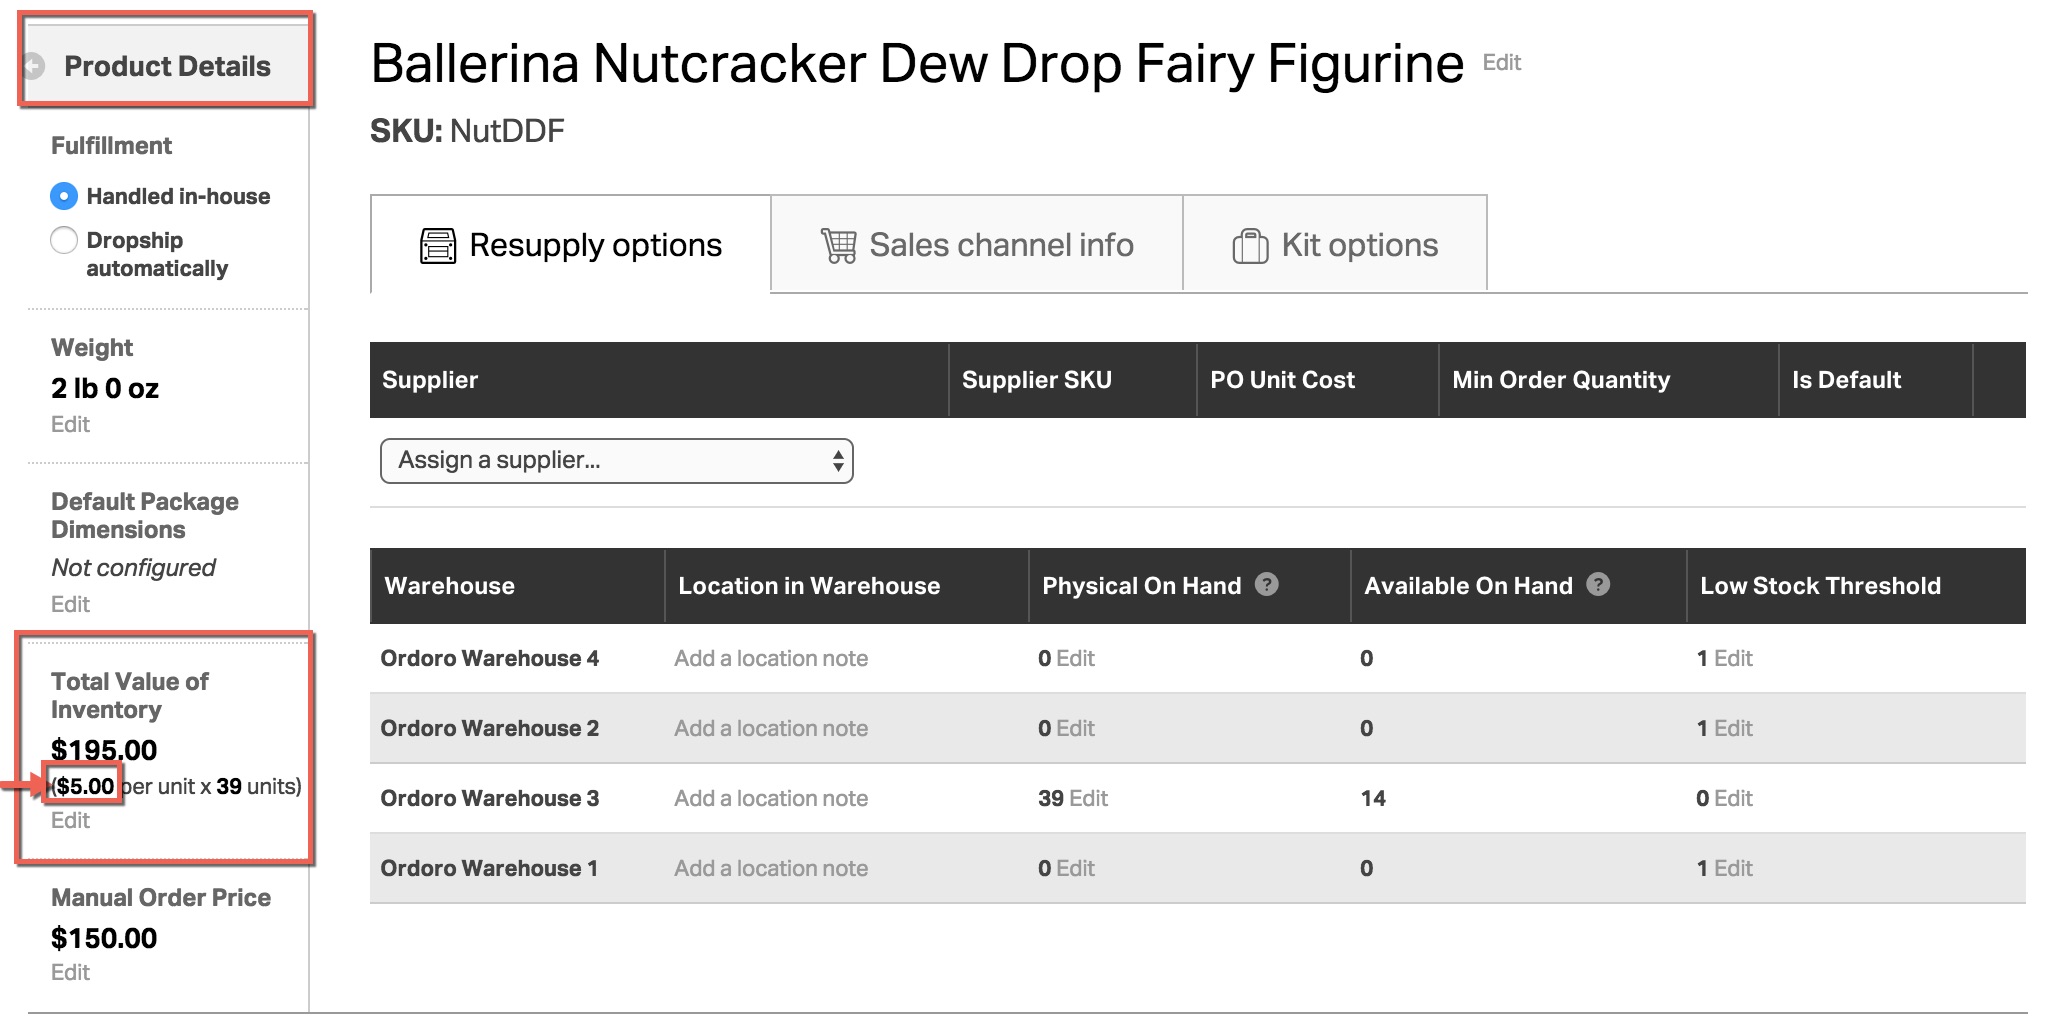
We look at the cost of each product you have entered into the “average cost” (Total Value of Inventory) field of that product. Here is how this number is calculated:
- Find all the shipments you shipped within the date range
- Find the cost of each product within one of those shipments
- Add all the product costs together
- Shipping Costs – This is the sum of the actual shipping costs you incurred on every shipment shipped within the date range selected. Here is how this number is calculated:
- Find all shipments you shipped within the date range selected
- Find the actual shipping cost of each shipment. If you printed the shipping label through Ordoro, then this number is the cost of the actual label. If you did not print the label through Ordoro, then this number is the cost you entered when marking the shipment as shipped
- Add all shipping costs together
- Total Costs – This is the sum of Product Costs and Shipping Costs as calculated above
Here too, you can mouse-over the chart to see the costs for any given day
Revenue & Costs Statement
This section shows you the information represented in the two sections above, but in a tabular format.
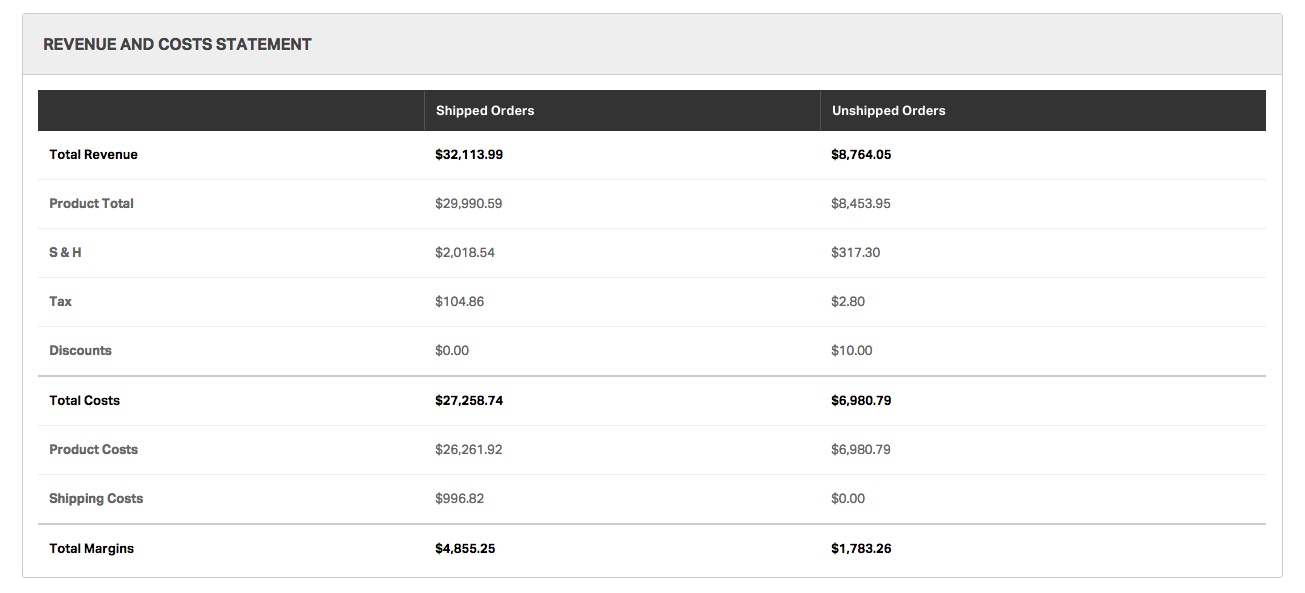
The totals are divided into two columns, Unshipped and Shipped, based on the status of your orders. Here is why we separate this data into two columns:
- For shipped orders, we know the exact shipping costs and product costs so we can calculate the margins correctly
- For unshipped orders, we do not know the exact shipping costs until the order has been shipped. Therefore, we cannot calculate the precise margins on those orders yet. We separate this data into a separate column so that we can correctly display the margins for the shipped orders
- For unshipped orders, the orders used to calculate these values are in Awaiting Fulfillment / New / In Process
- For Revenue, we aggregate all data for orders in those statuses. For example, we do not filter out products that have partially shipped. All products on open orders are included.
- For Shipping Costs, any partially shipped products may have an associated shipping cost and that is reflected here. Similarly, if a shipment has been dropshipped without a tracking number entered, it is listed here as well.
The margins are calculated as follows –
- For all orders, the revenue section is calculated by adding up information from all orders received within the date range selected. See the Revenue section above for more details
- For shipped orders, the costs are calculated by adding up information from all shipments shipped within the date range selected. See the Costs section above for more details
- Once the Total Revenue and the Total Costs are calculated for each column, the Total Margins are calculated as the difference between the Total Revenue and Total Costs
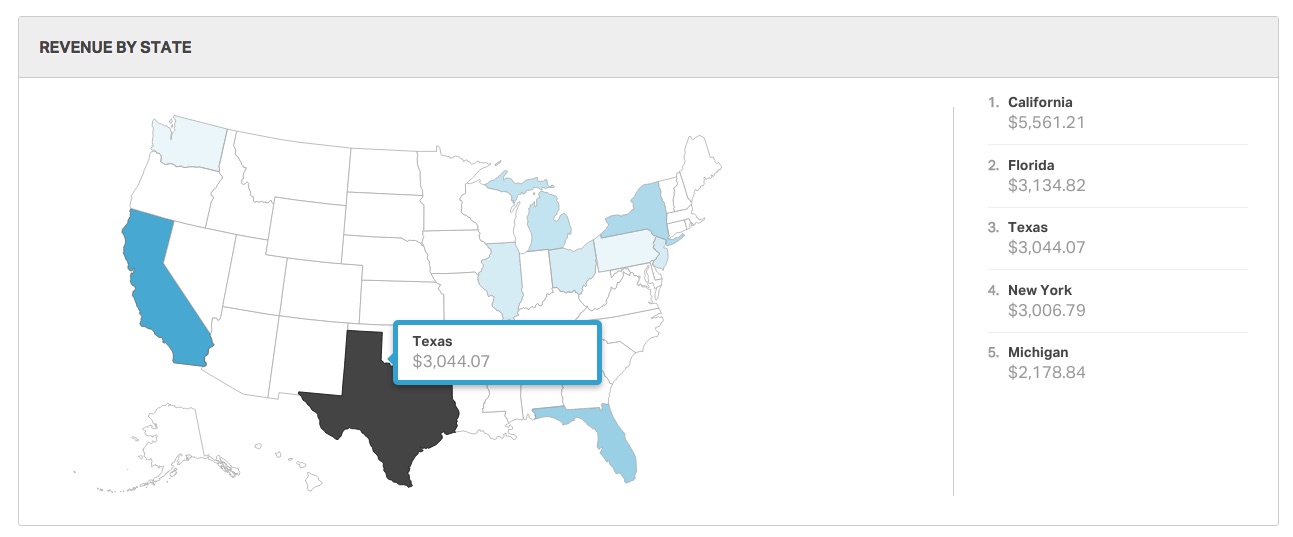
Revenue by State
This section shows your revenue by geography – across each state in the U.S.
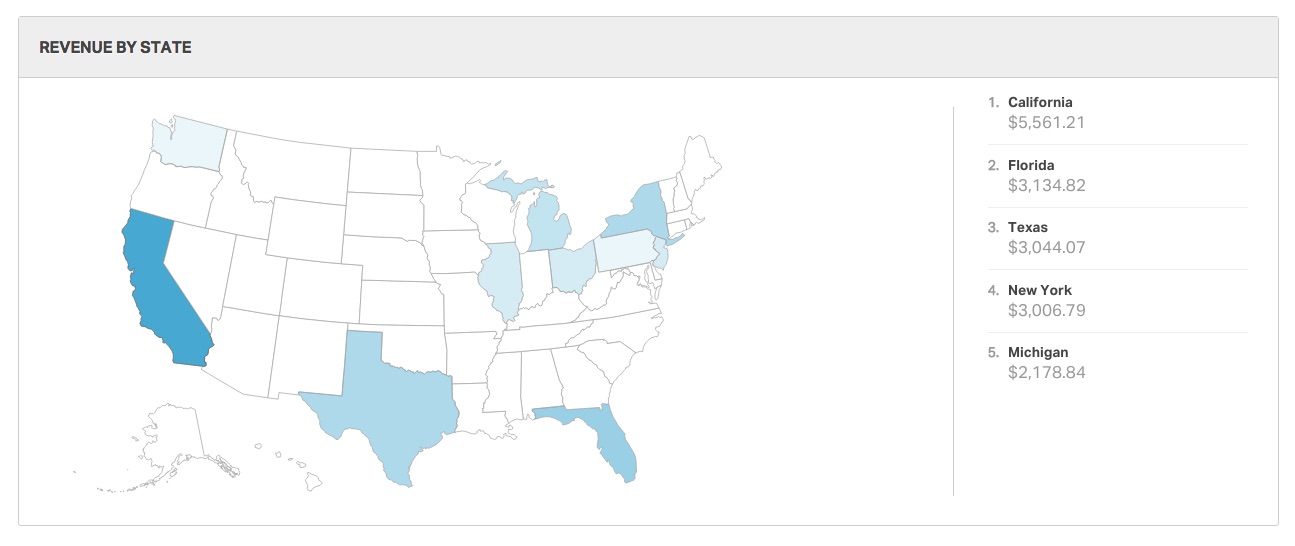
This is calculated by summing up all orders received within the date range selected and aggregating those revenues by the state field in the Ship To address. On the right-hand side of the chart, you will see the top five states listed.
You can mouse-over the chart to see the revenue from each state
Revenue by Sales Channel
This sections shows the total revenue segmented by the sales channel. This is helpful in figuring out which channel is performing best for your business.
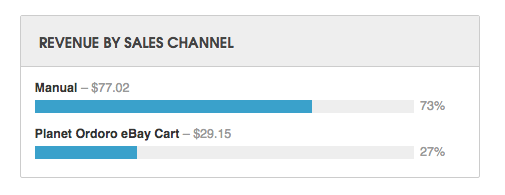
This is calculated by adding up the total price (Grand Total) for every order within the date range selected and aggregating by the sales channel you received that order from.
Revenue by Supplier
This sections shows the revenue across products from each supplier. This is helpful in figuring out which supplier’s products (or which brand if you want to classify it that way) is performing the best.
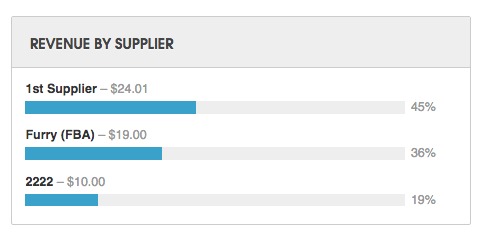
This section is calculated by adding the total price for every order within the date range selected and aggregating by the primary/default supplier for each product in those orders.
NOTE: We look at the primary/default supplier assigned to the product at the time the order was imported.
If you have any questions about Analytics please email support@ordoro.com and we will be happy to answer your questions!